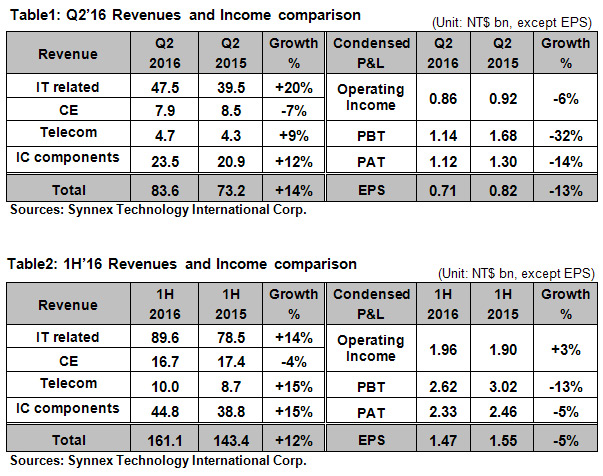
<Electronics stocks News>The performance for Q2’16 after the review by CPA: Consolidated revenue was NT$83.6bn, with a growth of 14% YOY. Operating income was NT$0.86bn. PAT was NT$1.12bn and EPS was NT$0.71 with a decline of 13% YOY from NT$0.82 in the last year. 1H’16 consolidated revenue was NT$161.1bn. Operating income was NT$1.96bn. PAT was NT$2.33bn, and after-tax EPS was NT$1.47, with a decrease of 5% YOY from NT$1.55 in the prior year.
Looking at the overall performance for Q2’16, in spite of the traditional low season for electronic industry and the threat from industrial depression, Synnex still achieved stunning revenue performance in Q2’16 continuing the growth from the last two quarters and hit the new high record over the same period, also superior to the overall market. By geographic segment, the well performance was from the consistent growth in Australia, New Zealand and Indonesia, and another crucial key was from China with a growth 14% YOY in Q2’16, maintaining the positive trend for continuous three quarters from Q4’15.
By the product segment, the IT product and IC component made brisk performance, and both set the highest record over the same period. In the IT product category, NB and PC total revenue grew with 25% YOY, significantly superior to the market. The expansion in market share of PC component and the hit of Gaming PB and PC led the revenue grew 12% YOY. Furthermore, due to the expansion of the product line of commercial market, the development of channel, the synergy from the cloud business contributed to the commercial revenue of server, internet and software growth with 33% YOY. In the IC component category, due to the expansion of the product line and the innovative supply chain service model brought the revenue growth 12%YOY, breaking the historical high record over the same period.
For the operating performance, Q2’16 gross profit amount was NT$2.81bn, with a growth of 8% comparing to the prior year. 1H’16 gross profit amounted to NT$5.70bn, with an increase of 7% from the prior year. Q2’16 operating income was NT$0.86bn, and 1H’16 operating income totaled to NT$1.96bn higher than NT$1.90bn in the last year. For the other income and loss, Q2’16 investment income was NT$0.29bn, mainly from the growth of India with 29%YOY and 1H’16 investment income amounted to NT$0.65bn. In terms of forex, Synnex had adjusted the forex management policy to reduce foreign exchange risk. However, due to the significant fluctuation of RMB/USD exchange rate in Q2’16, still causing the foreign exchange loss of NT$0.27bn in Q2’16 and NT$0.33bn in 1H’16. Q2’16 PAT was NT$1.12bn, and 1H’16 amounted to NT$2.33bn, with a decline of 14% YOY and 5% YOY respectively. The 1H’16 after-tax EPS amounted to NT$1.47.
In addition, Synnex BOD resolved the ex-dividend date on August 30th and the payment date expected to be on September 28th. The cash dividend is NT$1.5 per share and stock dividend is NT$0.5 per share.