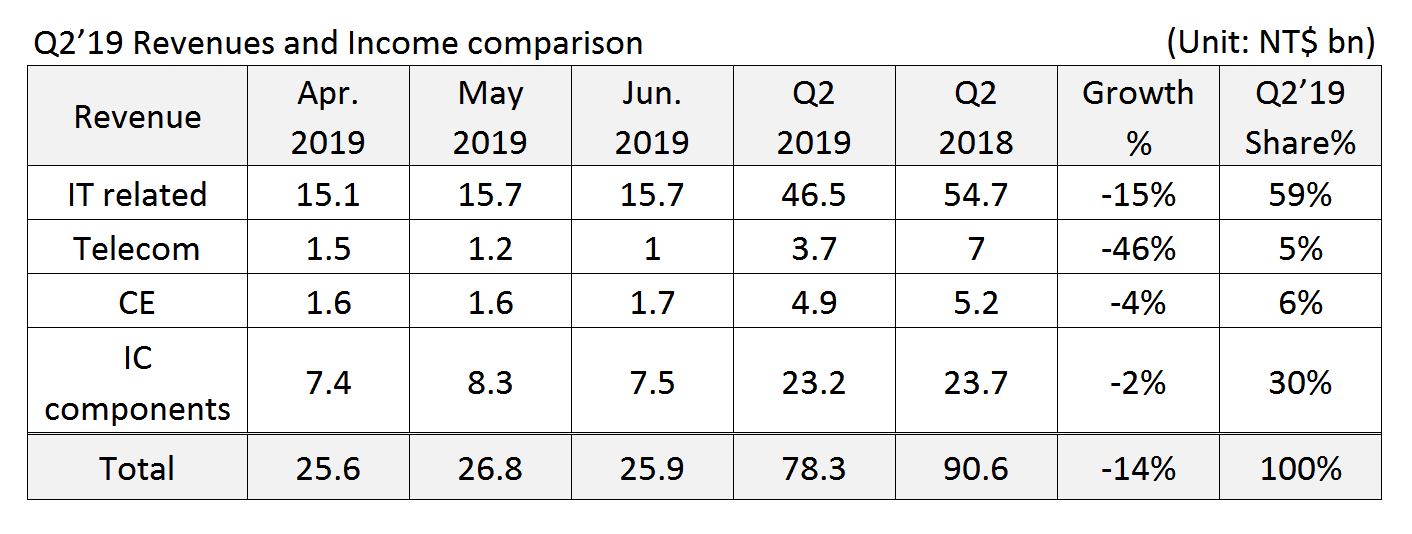
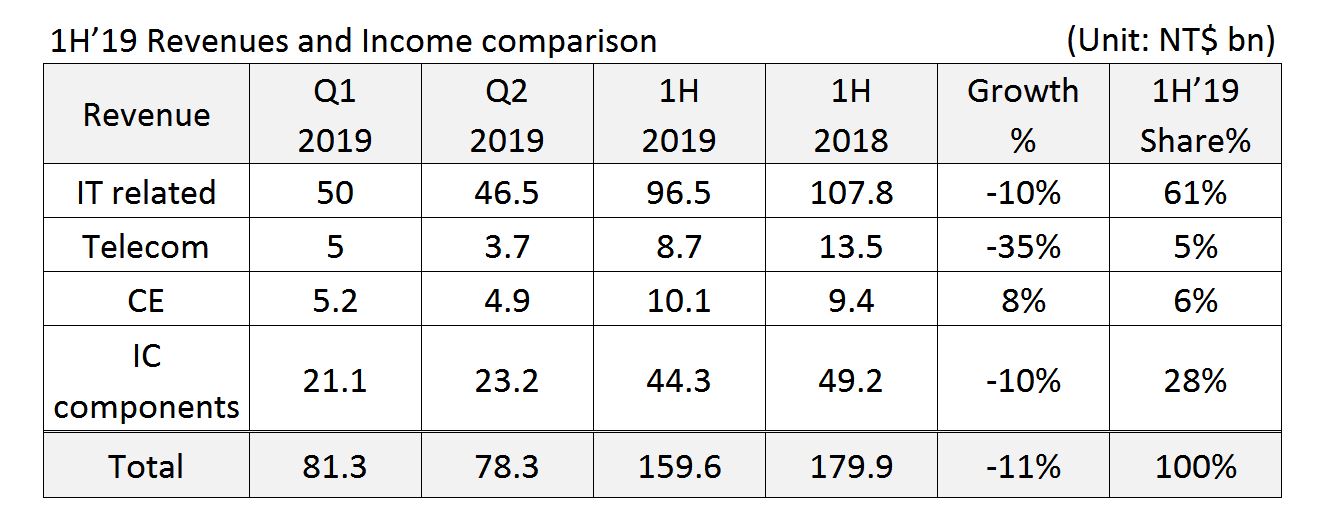
Synnex Y19Q2 preliminary consolidated revenue accumulated to NT$78.3bn, with decline of 14%YoY, due to effect of political and economic environment turmoil and economic slowdown. Y191H revenue accumulated to NT$159.6bn, decreased 11% YoY from last year.
Global economic environment showed decline trend mainly due to unsolved trade war disputes, causing end user lack of confidence and delay demand. Enterprises as well as took hesitated attitude toward investments. From geography aspect, the trade war impact in China and Australia was tremendous, leading double digit decline. However, the impact in Indonesia and Hong Kong was relatively small, and commercial market still remained stable momentum, showing growth 19% and 12% respectively.
From products aspect, consumer markets of distribution BU, NB, tablet and smart devices all dropped over 20% and mobile phone even dropped 46%, mainly resulted from the lack of unique selling points and conservative consumer confidence. Nevertheless, eSports revenue increased 165% benefited from the booming growth in eSports market. Although enterprise and government delayed big investment project purchase, but still proceeded digital transformation, IT security and cloud big data application, bringing commercial market growth 13% if exclusion from China market.
For IC components business, in spite of the uncertainty of trade war, manufactures started to adjust capacity allocation, and gradually restored stocking and manufacturing. Synnex IC components business already recovered the level in previous year, reaching revenue NT$23.2bn, and merely decreased 2%.
Looking forward to Y192H, although numerous uncertainty factors in trade war and pessimistic global economic, but mobile phone and NB new product will launch in Y192H, Intel CPU shortage expect to resolve, and enterprise and government IT investment will continue to proceed. Synnex expect Y192H performance will be superior to Y191H.
The historical trend of monthly consolidated revenue from 2015~2019

Note : Jan. and Feb. were adjusted by the two months average amount.
The historical trend of quarterly consolidated revenue from 2015 to 2019
